diff options
| -rw-r--r-- | README.md | 10 |
1 files changed, 9 insertions, 1 deletions
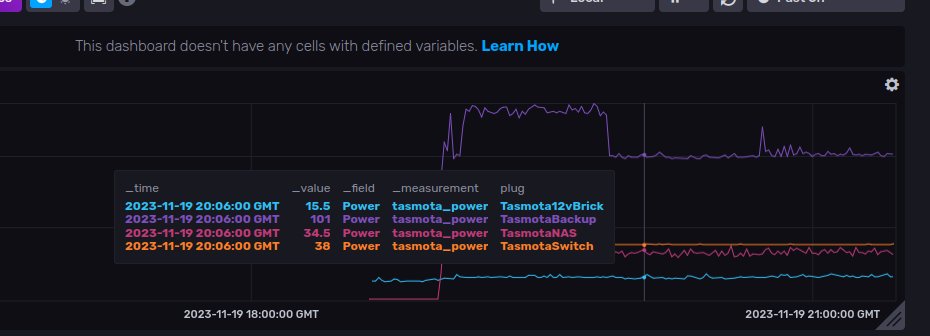
@@ -1,11 +1,13 @@ # power.eda.gay -Logs Tasmota-flashed power usage monitors to InfluxDB and Grafana using MQTT. +Logs Tasmota-flashed power usage monitors, and Tp-Link Omada POE switches, to InfluxDB and Grafana using MQTT. Looking for the Mikrotik POE usage monitor/exporter? That's been moved to [MikrotikPOEPowerExporter](https://github.com/jwansek/MikrotikPOEPowerExporter)  + + ## Setup - `cp power.env.example power.env` @@ -20,3 +22,9 @@ Looking for the Mikrotik POE usage monitor/exporter? That's been moved to [Mikro - Test with the `mosquitto_sub` and `mosquitto_pub` commands, the name of the package on debian is `mosquitto-clients` - Change the config in the Tasmota MQTT web UI, then check the logs to make sure it connects nicely - I like to run `TelePeriod 30` in the Tasmota console to set it to send MQTT messages every 30 seconds, for example. The default is every 5 minutes I believe + +## Switch setup + +You must enable SNMP in the Omada controller with the community string `tplink`: + + |
