blob: 9be58c27d0483904170c955fe3a2c275a2e27610 (
plain)
1
2
3
4
5
6
7
8
9
10
11
12
13
14
15
16
17
18
19
20
21
22
23
24
25
26
27
28
29
30
|
# power.eda.gay
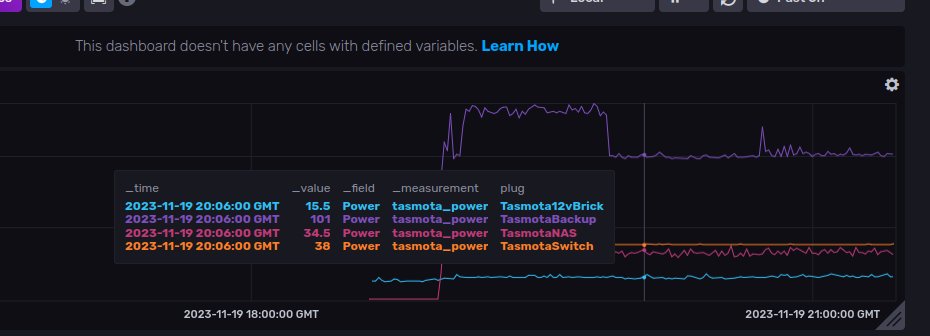
Logs Tasmota-flashed power usage monitors, and Tp-Link Omada POE switches, to InfluxDB and Grafana using MQTT.
Looking for the Mikrotik POE usage monitor/exporter? That's been moved to [MikrotikPOEPowerExporter](https://github.com/jwansek/MikrotikPOEPowerExporter)


## Setup
- `cp power.env.example power.env`
- Edit `power.env` as appropriate
- `touch .passwords`
- `sudo docker-compose up -d --build`
- `sudo docker exec -it poweredagay_mqtt_1 sh` Then in the container:
- `chmod 0700 /mosquitto/passwd_file`
- `chmod root:root /mosquitto/passwd_file`
- ` mosquitto_passwd -c /mosquitto/passwd_file user_name` Changing `user_name` as appropriate, then it will prompt for a password
- `sudo docker-compose restart`
- Test with the `mosquitto_sub` and `mosquitto_pub` commands, the name of the package on debian is `mosquitto-clients`
- Change the config in the Tasmota MQTT web UI, then check the logs to make sure it connects nicely
- I like to run `TelePeriod 30` in the Tasmota console to set it to send MQTT messages every 30 seconds, for example. The default is every 5 minutes I believe
## Switch setup
You must enable SNMP in the Omada controller with the community string `tplink`:

|
